Knowledge is power
We'd like to introduce you to our new Analysis feature within vPlan. Within Analysis, we combine multiple data points into clear graphs and tables. Visualizing this data helps you gain deeper insights. You can draw conclusions based on this information and potentially adjust or optimize processes. We'll further expand Analysis from various perspectives. With the introduction of time tracking, the initial part of Analysis is specifically focused on recorded time.
Analysis is temporarily available to everyone and will later become a standard part of the Professional package.

Different Reports
The first part of our analysis is based on time tracking. We combine planned time with recorded time. You can always select the period you want to analyze. The period is set to this week by default. The analysis consists of the following reports:
- Time tracked per activity
- Time tracked per user
- Timeline
- Data Analysis
Below, we will briefly explain each report.
Time tracked per activity
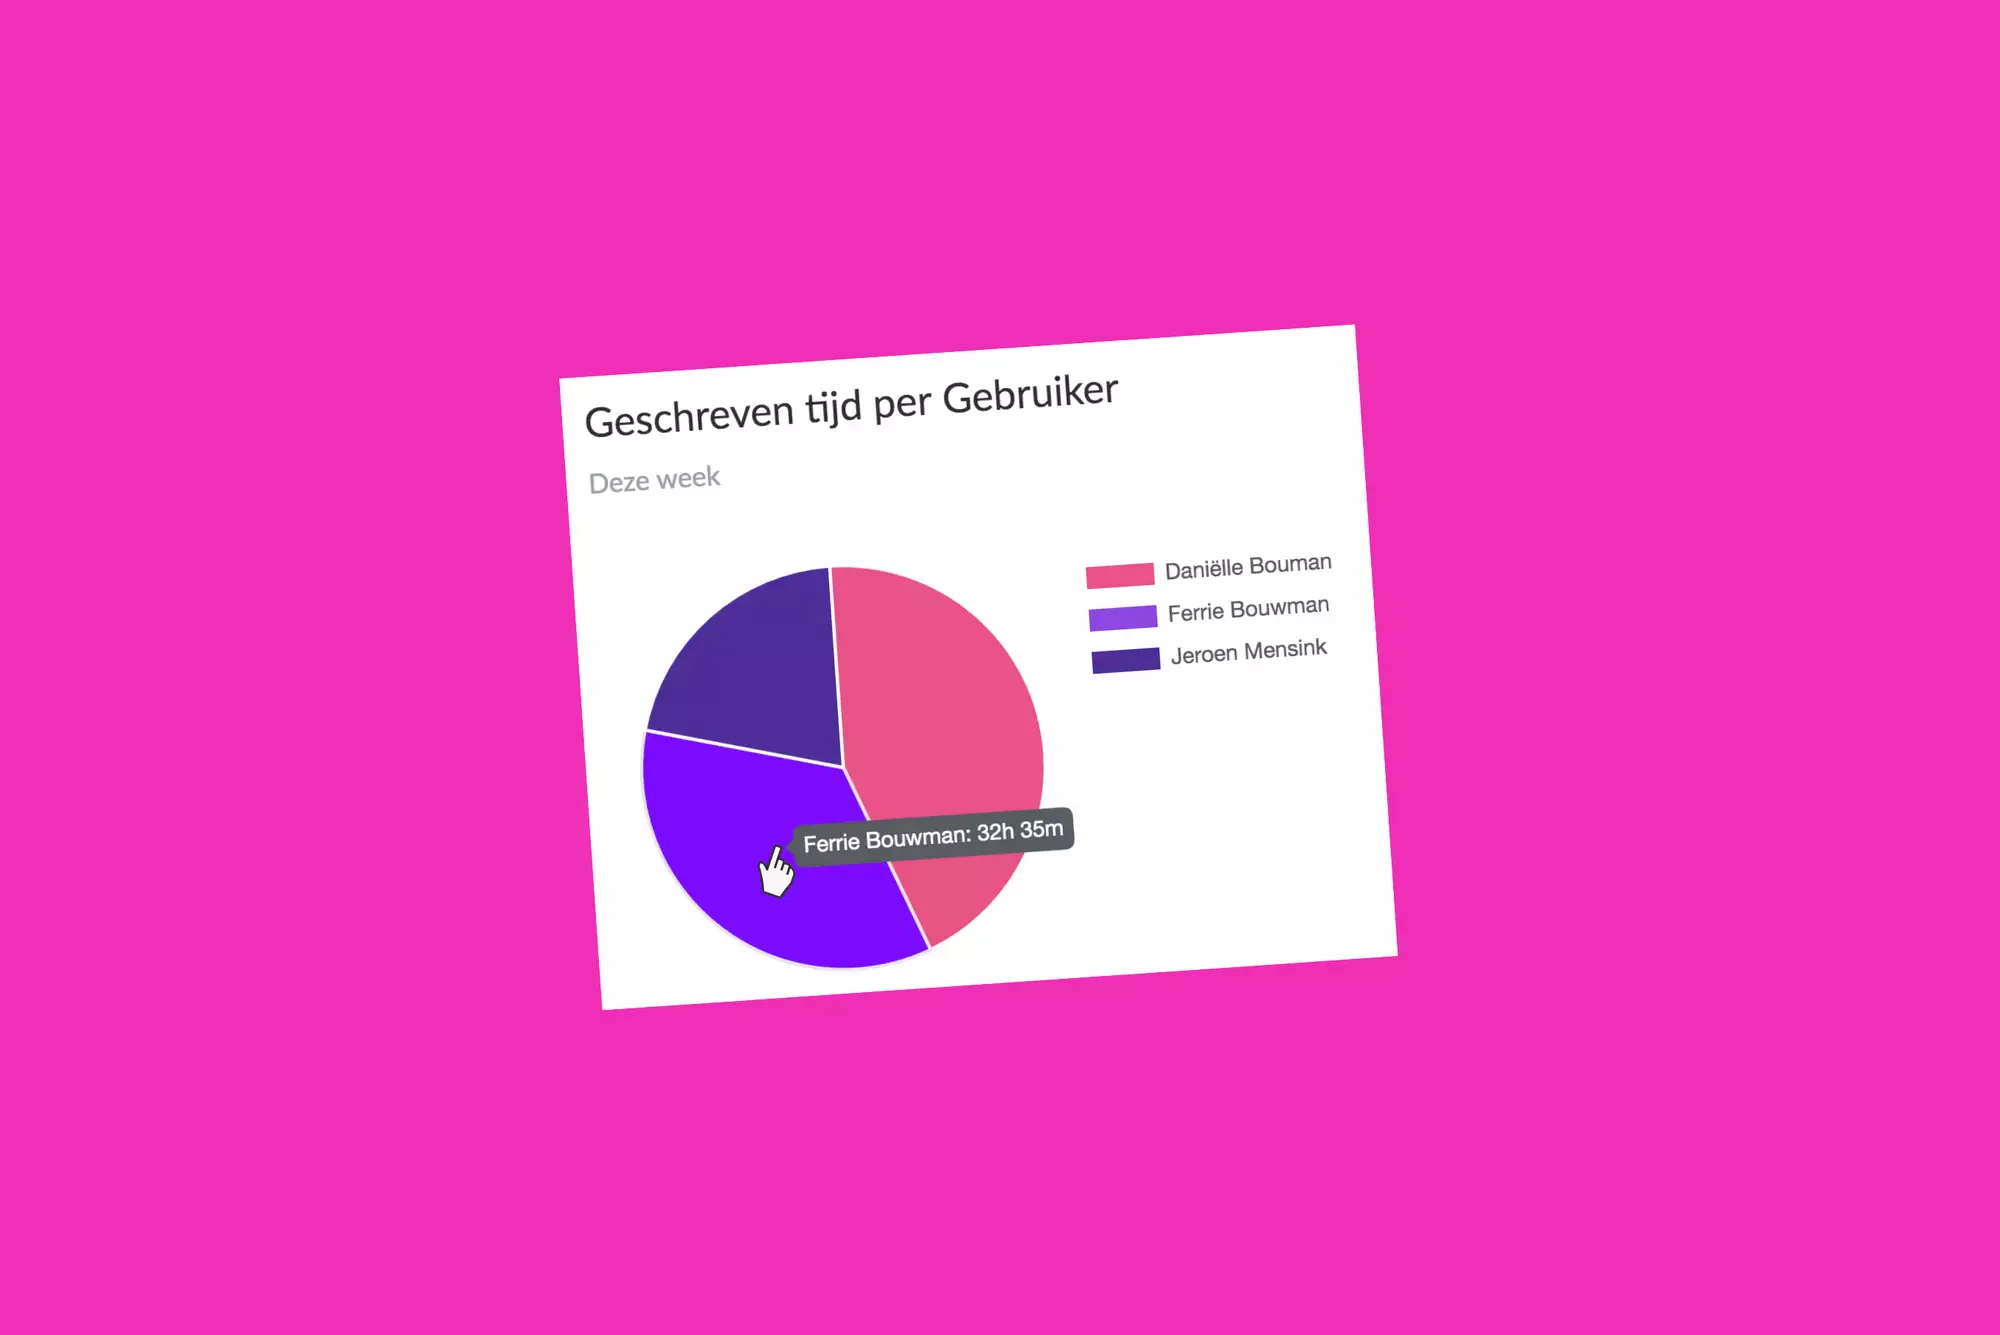
In this pie chart, you can see time tracked per activity during the period. Click on the activity in the legend to show or hide it. Hover over the pie chart to see the recorded time per activity.
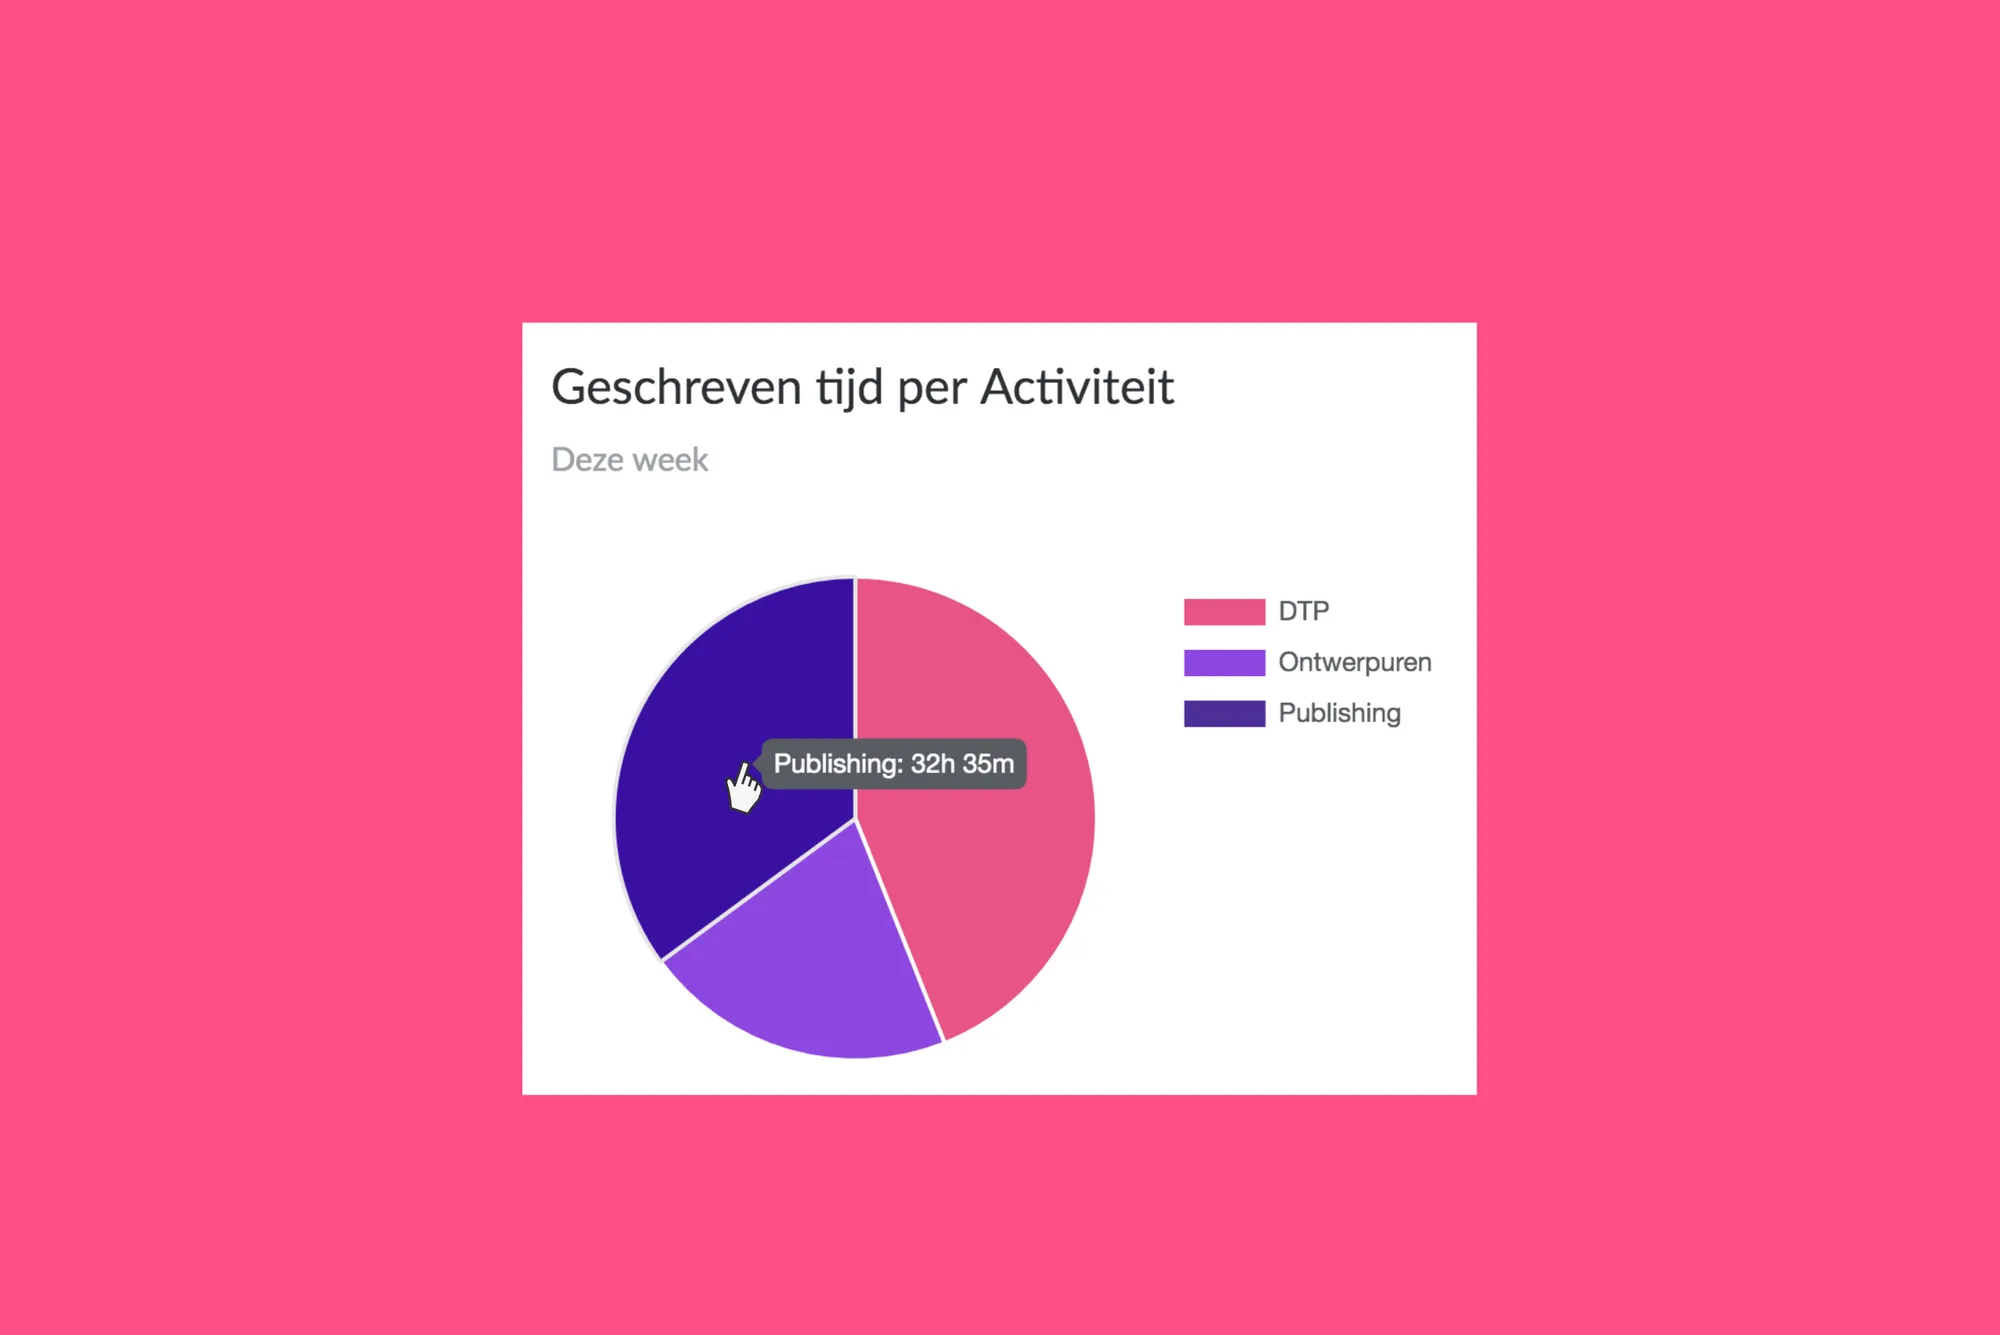
Time tracked per activity
In this pie chart, you can see time tracked per activity during the period. Click on the activity in the legend to show or hide it. Hover over the pie chart to see the recorded time per activity.
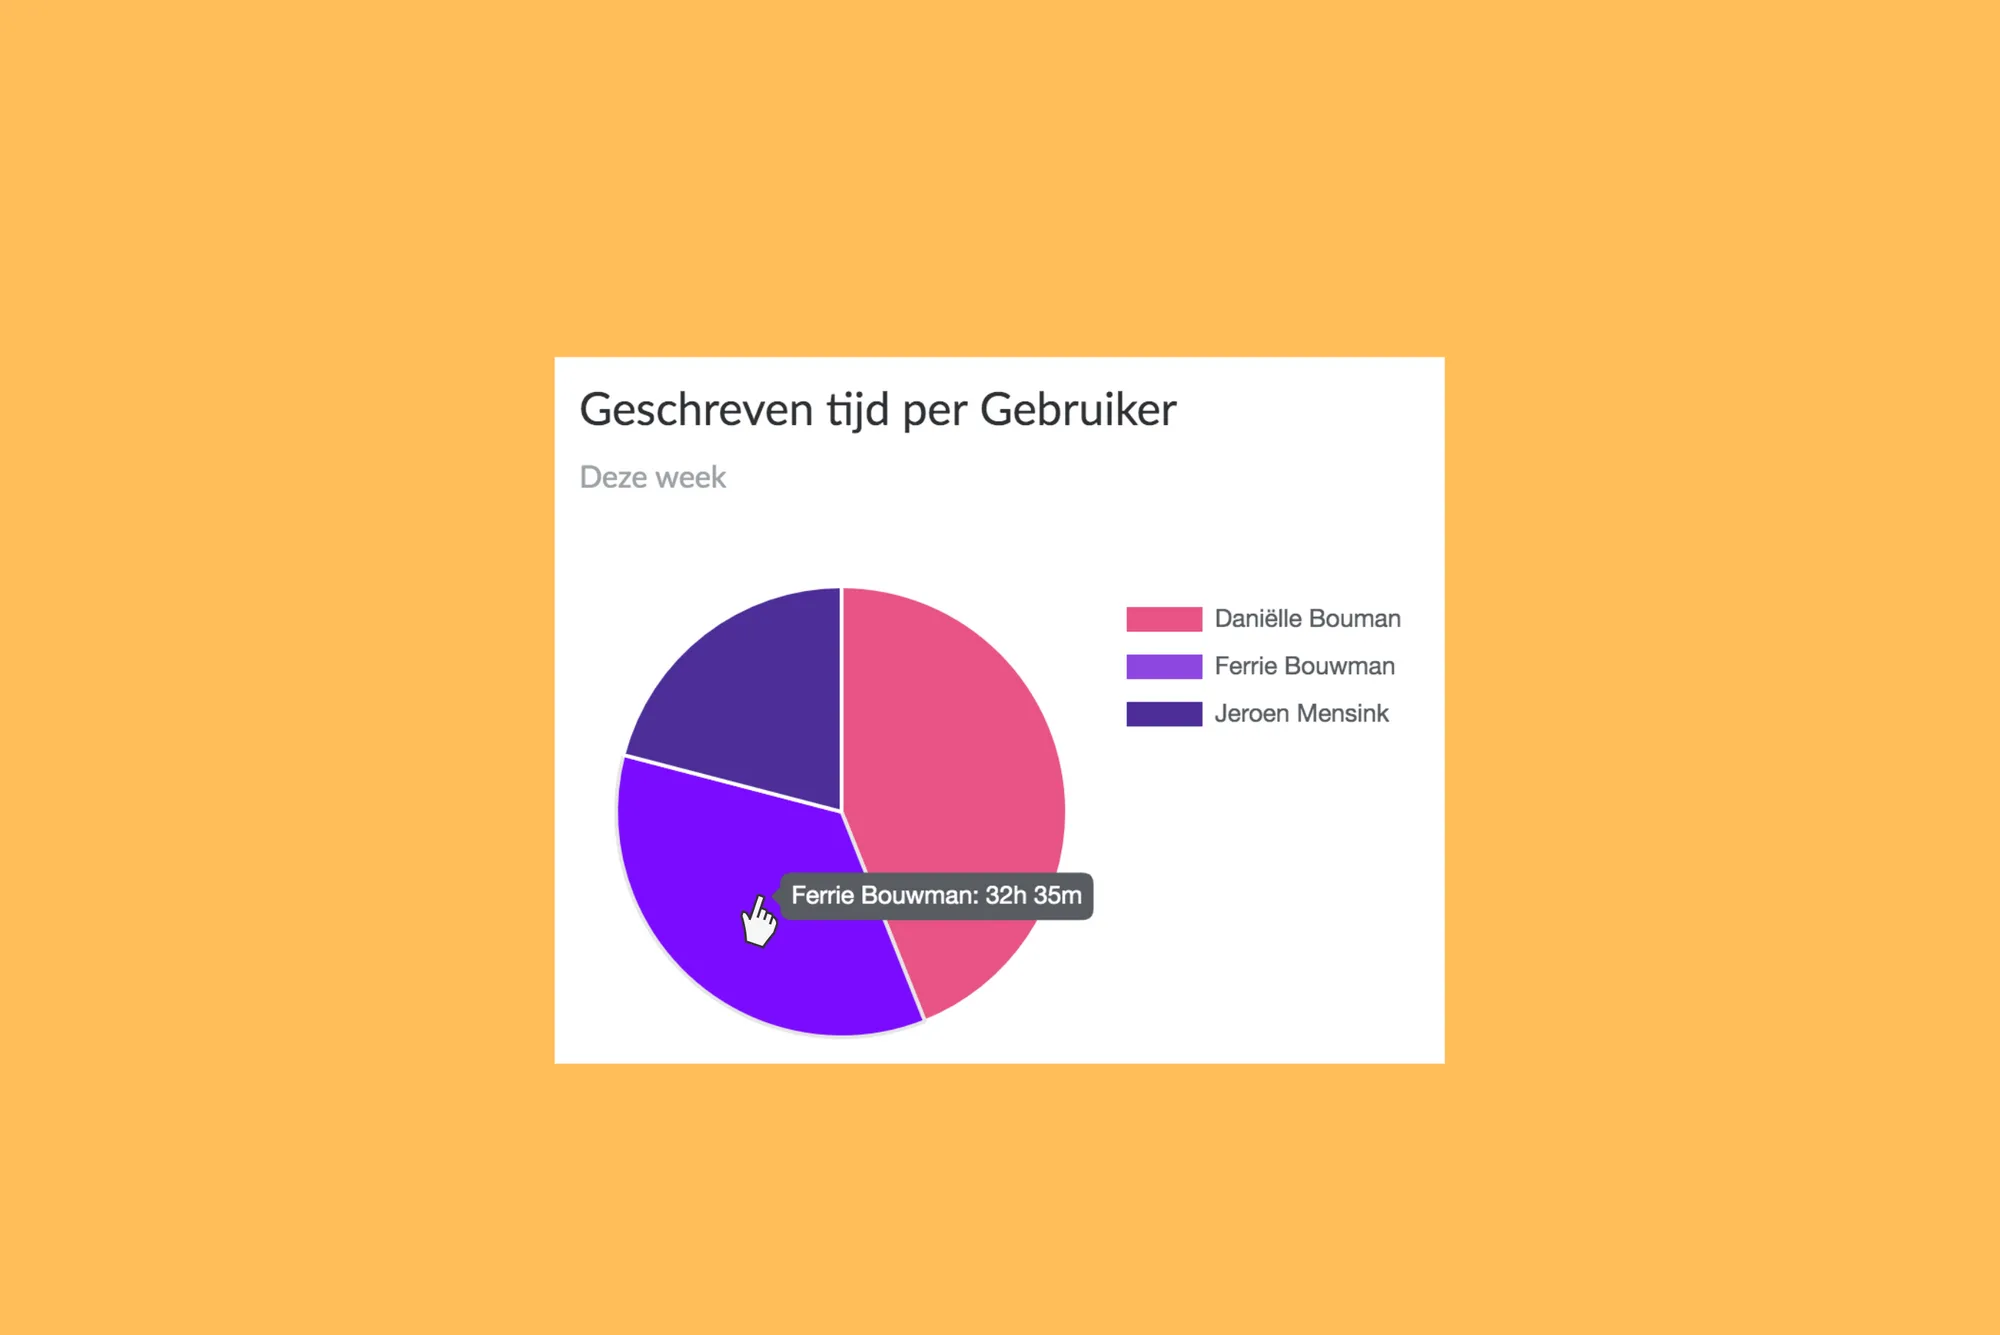
Timeline
In the timeline, you can see the available time, planned time, and recorded time over the chosen period. You can choose to display the graph in a bar chart or line chart. You can also choose to filter by resource type and phases.
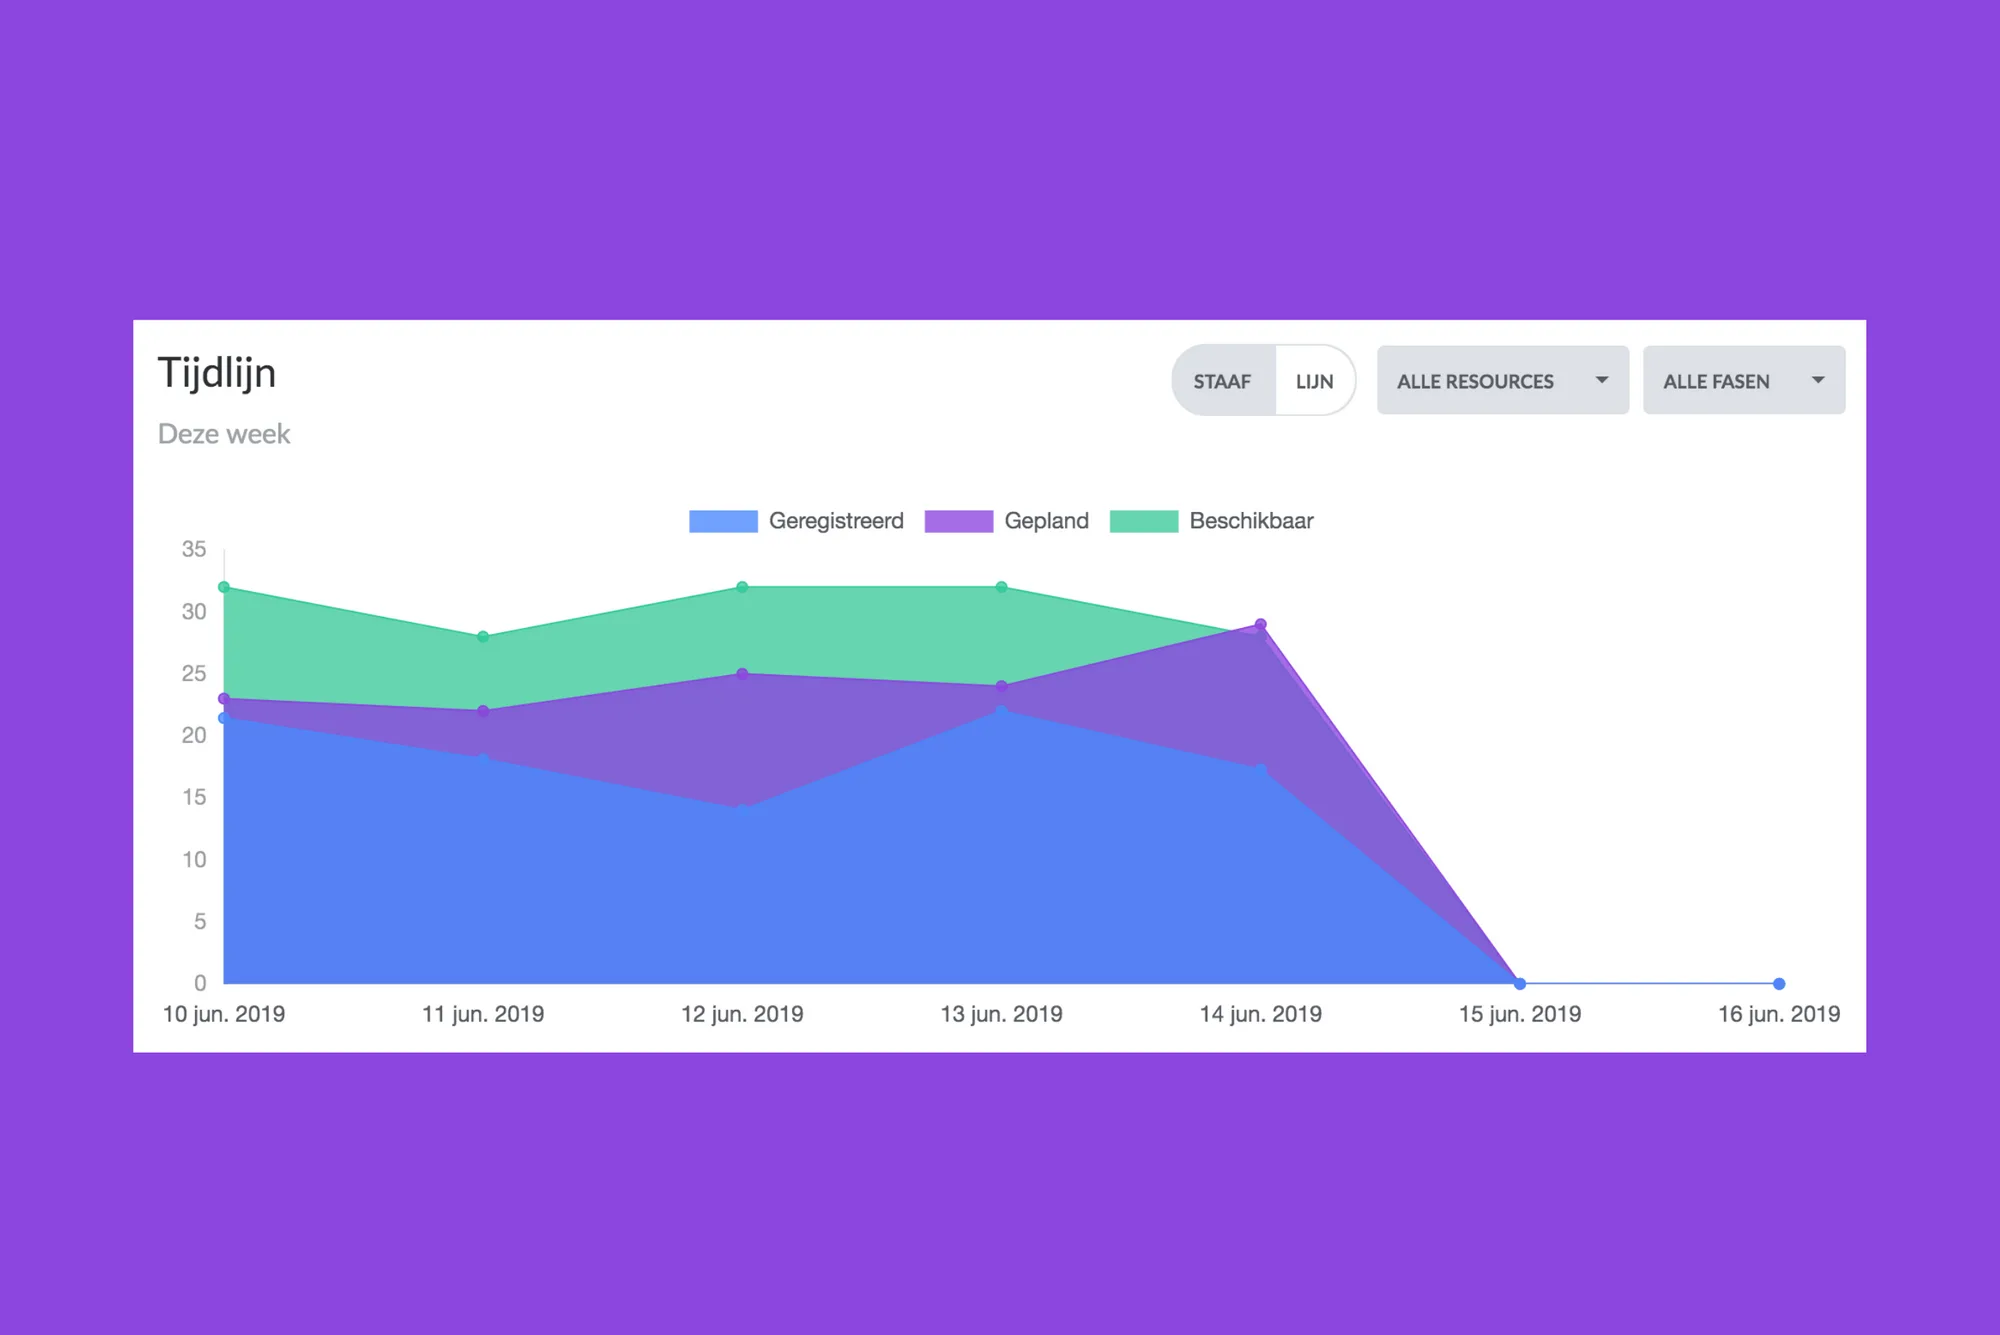
Data Analysis
In the data analysis, you'll see a report clearly displaying the results over the chosen period. You can display the results at the phase level or activity level. The result is determined by subtracting the recorded time and remaining time from the planned time. A result in green signifies time gained compared to what was planned. A result in red indicates time lost compared to the plan. You can also export this report to Excel.
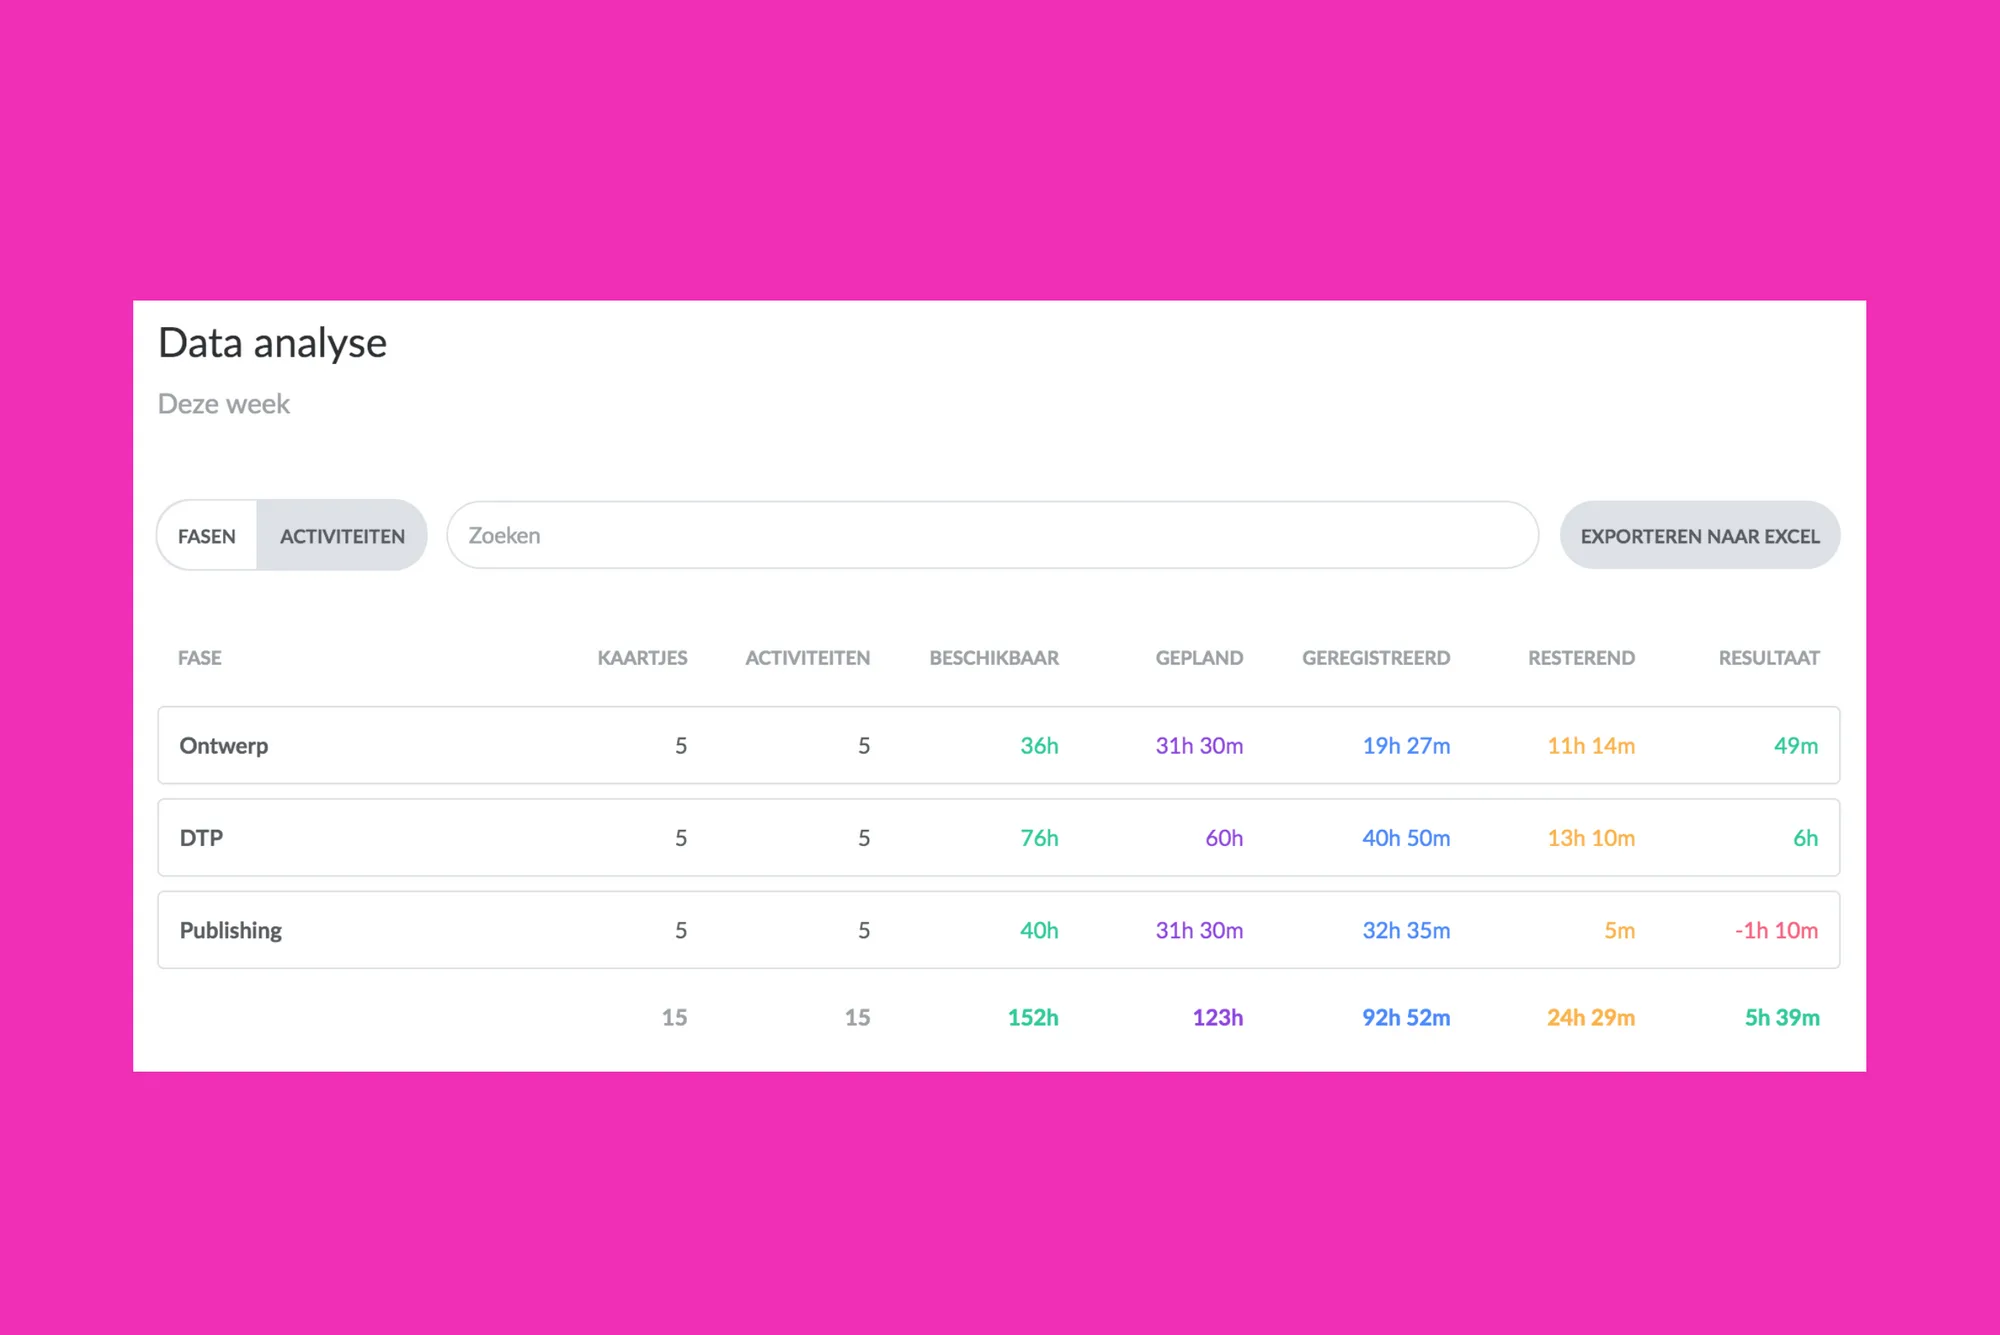
Questions
If you're a vPlan user, you can start tracking time now. We've temporarily provided this functionality to all our users. This functionality will soon only be available in vPlan Professional.
Do you have any further questions? Feel free to ask our sales team.
Try it in your own vPlan
Every new feature is in the free trial.