


vPlan AI is in beta -> Sign up now
Without an overview, there’s no control. And without control, there’s no grip on your planning. How much time has been spent? Where are the bottlenecks? Where is capacity available? With vPlan’s dashboard, you see it all at a glance. Clear, personal and action-oriented.


Do you really want to get a grip on your working day? Start your day in the dashboard: vPlan Home. Here you can see everything that matters to you at a glance, brought together from all your planning boards.

The analysis view provides insight into your data in clear graphs, tables and dashboards. You can see exactly how your team is performing, how much capacity remains, and where there’s room in the planning.

With our time tracking dashboard, you can see at a glance who is spending time on what, how productive your team is, and what you can invoice.

Want to get even more out of your data? Thanks to our open API, you can easily unlock all relevant data from vPlan. This allows you to link vPlan with tools such as Power BI and combine your planning data with other data sources. Build customised interactive dashboards, dive deeper into your analyses, and share insights with your team.

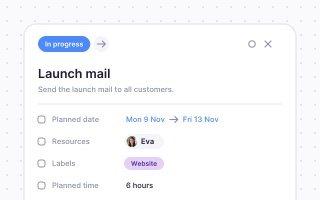
Plan, assign and follow up every task in one place.
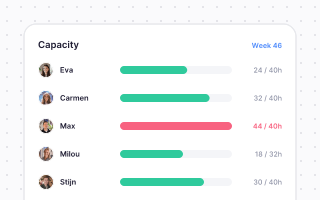
See who has room and plan around real availability.
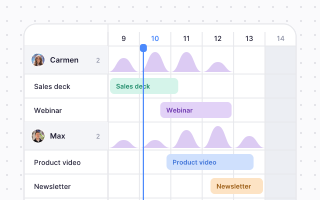
Spot overload early and spread work evenly.
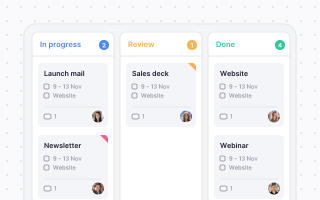
Switch between timeline, kanban, list and calendar.
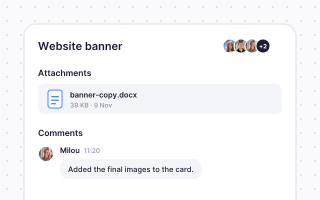
Comments, files and updates right where the work is.
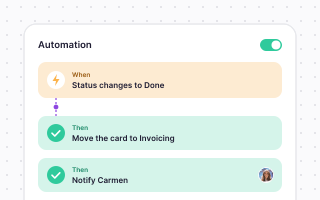
Let smart rules take over the repetitive work.
Planning that works doesn't have to be a challenge. With vPlan, you work smarter, not harder. From simple workflows to real-time collaboration.


“We know exactly what we’re working on, what’s already been done, and what still needs to happen.”

Marnique Assink
Marketing coordinator, Farm Food

Wilco de Moet
Smits Vastgoedzorg

“Without vPlan, we wouldn't have been able to grow so fast.”

“Everyone accesses the same information, which strengthens collaboration and helps prevent errors.”

Stephan
Financial director, Vredehof
“vPlan gives us a clear overview, allowing us to respond quickly and work more productively.”

Romy Groot Obbink
Site producer, Absolutely Fresh

Marten van Ruitenburg
Fraanje

“We now have one central place where everything comes together. It provides not only clarity, but also peace of mind.”

“Standard processes can now be adapted to specific needs without customization, which increases efficiency and improves collaboration.”

Thomas Brunink
Operations Manager, Brunink Group

Rob Detert Oude Weme
DDJ
“We don't guess anymore; we know exactly what we can deliver.”